
Your 2025 wedding will likely cost $15,000-$40,000, not the misleading $33,000 average that’s skewed by luxury outliers. You’ll spend roughly $284 per guest, with location driving 70% of costs—Manhattan weddings hit $87,700 while midwestern ceremonies can run under $20,000. The vendor breakdown matters enormously: venue/catering (40%), photography ($1,000-$10,000), florals ($2,200 average). Your actual number depends on guest count, region, and priorities—factors the industry conveniently obscures behind aspirational averages.
Why Published Averages Are Useless
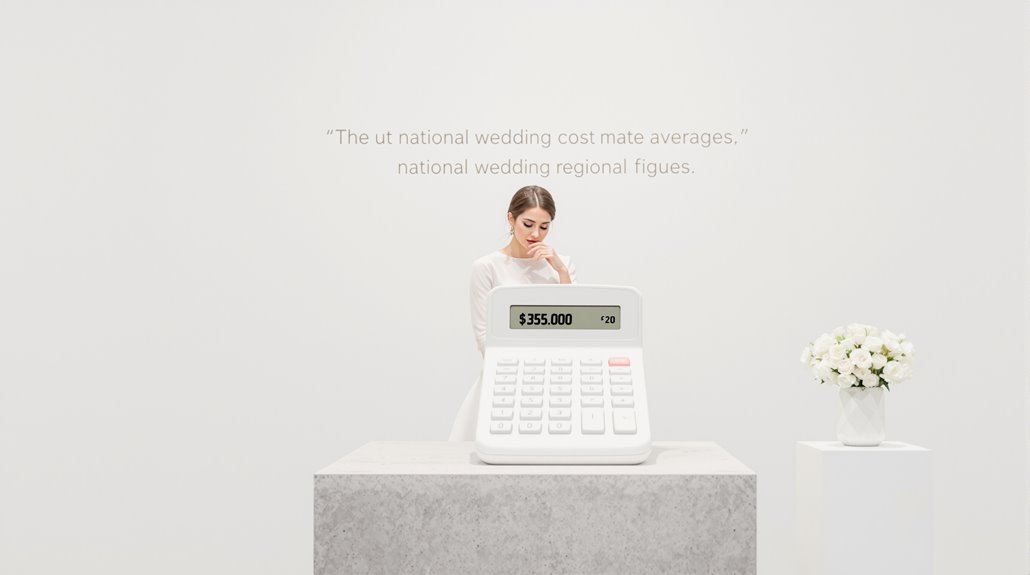
When you encounter those jaw-dropping wedding cost averages of $30,000+, you’re witnessing one of the wedding industry’s most persistent statistical illusions. The truth? The median wedding price range hovers between $10,000-$13,195—less than half the national average of $32,899-$36,000.
This 65-70% gap isn’t accidental. It’s mathematical sleight-of-hand, where affluent outliers dramatically skew averages upward while most couples spend far less. And yet, methodology matters profoundly here. The Knot’s contract-based data shows $33,000, while Zola’s vendor tracking pushes figures to $36,000—a $3,000 difference from essentially similar information. The industry’s spending distribution creates what experts describe as a steep mountain with an extended tail of high-end outliers. In managing complex project timelines, it’s crucial to recognize these disparities in data representation.
You’re not seeing real wedding costs in these numbers but rather the spending patterns of couples already committed to formal, multi-vendor celebrations. Self-selection bias runs rampant; couples planning courthouse weddings or backyard gatherings simply don’t participate in these surveys. The averages exclude precisely what most people actually spend.
Regional Cost Variations: Major Metro Analysis – NYC LA Chicago Miami data
Stepping away from the statistical illusions of national averages reveals where your actual wedding budget lands—squarely in the domain of geography.
The wedding cost by city in 2025 showcases staggering disparities: Manhattan ceremonies average $87,700—America’s priciest matrimonial terrain—while outer boroughs provide 46% savings at $46,808. You’ll face venue fees in Manhattan running 146% above national averages. For many couples, booking early is essential as venues require 12-18 months advance reservations to secure better rates. Additionally, affluent couples often prioritize quality markers in their decision-making, impacting overall spending. And yet, even the median NYC wedding ($20,780) offers a more realistic baseline than published averages suggest.
Chicago positions itself as the shrewd compromise in the wedding price range conversation at $54,190—$20,895 less than NYC but still demanding a 50% premium over national figures. Washington D.C. ($70,600) and San Francisco ($51,500) complete the top-tier metropolitan wedding cost 2025 terrain, where peak season (May-October) commands an additional 20-30% premium. Your location doesn’t just influence your budget—it fundamentally rewrites it.
Cost by Guest Count – 50 100 150 200+ guests
Understanding that your guest list directly determines your wedding’s price tag reveals the most practical budgeting approach in an industry obsessed with misleading averages.
The wedding price range follows a remarkably consistent pattern: $284 per guest provides exceptional explanatory power for what your celebration will actually cost. You’ll find this formula works whether you’re planning an intimate gathering or a grand affair—and yet, regional variations can multiply this baseline dramatically.
| Guest Count | Typical Budget | Key Considerations |
|---|---|---|
| 50 | $14,200 | Intimate venues, limited décor needs |
| 100 | $28,400 | The “sweet spot” for vendor availability |
| 150 | $42,600 | Requires larger venues, expanded catering |
| 200+ | $56,800+ | Limited venue options, coordination complexity |
How much does a wedding cost? Your headcount makes the difference between a $15,000 intimate celebration and a $65,000+ lavish event in major metros—numbers that actually reflect what real couples pay. Additionally, understanding emerging luxury trends can help couples make informed decisions about their wedding aesthetics and choices.
Vendor Cost Ranges by Category – Photography florals catering etc
Breaking down your wedding vendor budget reveals where every dollar actually goes—and why so many couples experience sticker shock despite “doing their research.” Each vendor category commands its own price range with surprisingly little wiggle room, particularly for in-demand professionals during peak season.
Wedding professionals operate within established price ranges that explain why sticker shock happens even to the most prepared couples.
Your 2025 wedding vendor terrain looks something like this:
- Catering: The heavyweight champion at $8,500-$10,000 for 100 guests, scaling proportionally with your headcount and menu complexity
- Photography/Videography: $1,000-$10,000 for photos, $1,000-$7,000 for video—bundling often saves money, but don’t expect bargains
- Florals: Averaging $2,200 (8-10% of total budget), with seasonal availability dramatically affecting what’s possible
- Planning: $1,400 for day-of coordination, $4,100 for full-service planning—seemingly optional until you’re drowning in logistics
Entertainment rounds out your major expenses, with DJs commanding $1,600-$2,200 for standard reception coverage. Each category represents non-negotiable infrastructure, not frivolous extras.
Budget Tiers: $30K $60K $100K $200K+
Wedding budgets function as your financial genome—determining exactly what’s possible and what’s fantasy no matter your inspiration boards. The national average hovers around $33,000, but this figure masks dramatic regional variation.
| Budget Tier | Guest Count | Key Components | Typical Locations |
|---|---|---|---|
| Entry-Level $15K-$25K |
53-88 | DIY elements, restaurant reception | Alaska, Wyoming, Utah |
| Standard $30K-$35K |
105-123 | Professional photography, full catering | Florida, national average |
| Upper-Middle $40K-$60K |
140-210 | Premium vendors, elevated packages | New Jersey, Northeast |
| Luxury $60K-$200K+ |
210+ | Designer attire, destination elements | NYC, Washington DC |
Your generation profoundly impacts spending—Gen X averages $23,000 while Millennials typically invest $38,000. That $284 per-guest metric provides your clearest calculation tool; multiply by your guest count and you’ll quickly discover your tier. And yet, many couples find themselves straddling categories, splurging on photography while economizing elsewhere.
What Determines Your Actual Cost
While bridal magazines tout “average costs” that look suspiciously identical year after year, your actual wedding budget will be determined by five critical factors that professionals rarely discuss openly. Your location drives everything—with Massachusetts ceremonies costing nearly $18,000 more than Arkansas celebrations, and urban venues commanding premium prices regardless of state.
When dissecting real costs, remember:
- Guest count isn’t just about headcount—it’s multiplication. Each additional person triggers cascading expenses across catering, rentals, and space requirements.
- Venue selection represents your single largest investment (30% of total budget), with traditional spaces averaging $11,500-$15,000.
- Catering devours up to half your budget, with 100-person service running $8,500-$10,000 before alcohol.
- Entertainment, photography, and décor combine for another 25-30%, with regional pricing variations of 40-60%.
The truth? You’re not paying for a wedding—you’re financing a complex hospitality event with wildly variable inputs.
How to Estimate Your Real Number

Calculating your wedding budget requires moving beyond deceptive averages into hard mathematics based on real-world variables. The most reliable method? Multiply your guest count by the per-guest cost in your region—it’s brutally predictive.
| Calculation Method | Formula | Accuracy | Adjustment Factor |
|---|---|---|---|
| Per-Guest Formula | Guests × $256-375 | Highest | Location premium |
| Category Allocation | 40% food/venue | Strong | Season affects pricing |
| Median Comparison | $13,195 baseline | Moderate | Add luxury elements |
| Vendor Quotes | Sum actual bids | Perfect | Always add 15% buffer |
You’ll want to establish your non-negotiables first—venue, photographer, dream dress—then work backward. And yet, even the most fastidious planners underestimate by 15-20%. Reality intrudes: that Pinterest-perfect floral installation costs triple what you’ve imagined, and suddenly you’re facing brutal trade-offs between open bar and live band.
Conclusion
Despite the avalanche of statistics bombarding committed couples, the true cost of your 2025 wedding ultimately exists within the tension between aspiration and financial reality. You’ll discover that averages—those lofty $30,000+ figures—rarely capture what most people actually spend, and yet they create damaging expectations that drive unnecessary debt.
The wedding industry profits from your anxiety while your future together demands financial wisdom over fleeting extravagance.
Consider these essential truths about wedding costs:
- The $284 per-guest metric provides your most reliable budgeting tool, transcending geographic and demographic variations
- Your location determines up to 70% of your final price tag—D.C. couples face quadruple what Alaskans typically spend
- Median figures ($10,000-$13,000) reflect actual American spending patterns far better than averages
- Generational identity considerably impacts spending thresholds—Millennials outspend Gen Z by nearly $20,000
The wedding industry thrives on convincing you that spending equals love. But your marriage deserves financial sanity, not Instagram validation purchased through credit card debt.